))
))
))
))
))
))
))
))
| Daily Statistics | |||||
| Day [+] | Tmin °C | Tmax °C | Mean °C | σ | n |
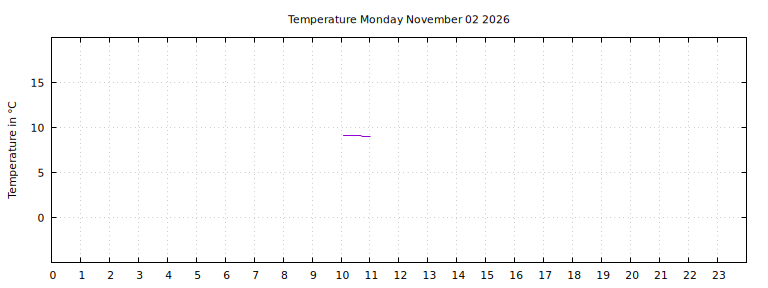
| Monday November 2nd | 9.0 | 9.1 | 9.1 | 4% | 24 |
| Sunday November 1st | 9.0 | 9.2 | 9.1 | 7% | 97 |
| Saturday October 31st | 9.1 | 9.3 | 9.2 | 6% | 84 |
| Friday October 30th | 9.3 | 9.5 | 9.4 | 7% | 163 |
| Thursday October 29th | 9.3 | 9.6 | 9.5 | 10% | 98 |
| Weekly Statistics | |||||
| Week [+] | Tmin °C | Tmax °C | Mean °C | σ | n |
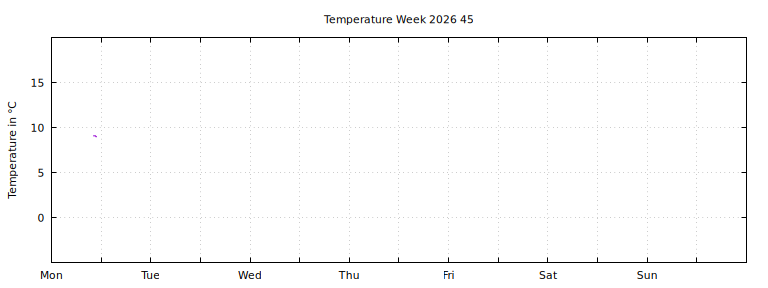
| Week 45 (November 2nd) | 9.0 | 9.1 | 9.1 | 4% | 24 |
| Week 44 (October 27th) | 9.0 | 9.6 | 9.3 | 15% | 608 |
| Week 43 (October 19th) | 9.7 | 10.8 | 10.2 | 32% | 243 |
| Updated every hour. |
|
|
| Monthly Statistics | |||||
| Month [+] | Tmin °C | Tmax °C | Mean °C | σ | n |
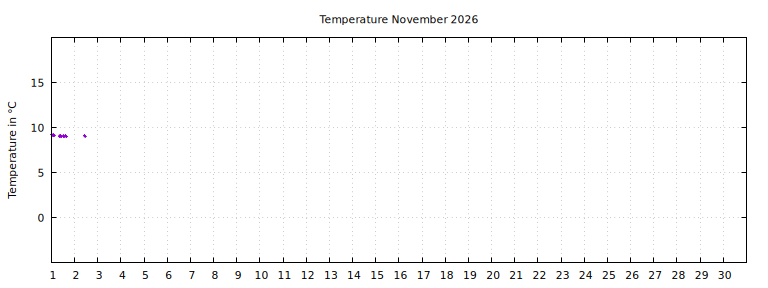
| November 2026 | 9.0 | 9.2 | 9.1 | 6% | 121 |
| October 2026 | 9.1 | 14.8 | 12.0 | 181% | 2731 |
| September 2026 | 14.1 | 18.3 | 15.8 | 114% | 4265 |
 |
| Yearly Statistics | |||||
| Year [+] | Tmin °C | Tmax °C | Mean °C | σ | n |
| 2026 | 9.0 | 27.4 | 18.6 | 352% | 27767 |
| 2019 | 9.8 | 14.1 | 12.1 | 98% | 86 |
| 2018 | -1.6 | 30.2 | 14.1 | 551% | 4060 |
Currently 60169 temperuture meausurements in the database.
|
| (c) Daniel Vindevåg 2004-2021 |
))
))
))
))
))
))