))
))
))
))
))
))
))
))
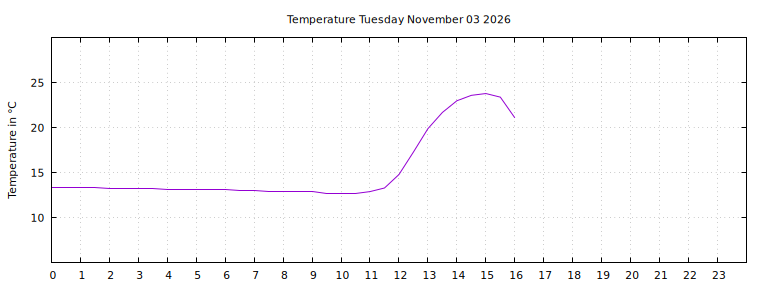
| Daily Statistics | |||||
| Day [+] | Tmin °C | Tmax °C | Mean °C | σ | n |
| Tuesday November 3rd | 12.7 | 23.8 | 14.8 | 350% | 31 |
| Monday November 2nd | 13.3 | 13.8 | 13.5 | 13% | 48 |
| Sunday November 1st | 13.3 | 15.0 | 14.0 | 58% | 48 |
| Saturday October 31st | 15.0 | 19.1 | 16.4 | 121% | 48 |
| Friday October 30th | 17.3 | 29.4 | 21.4 | 353% | 48 |
| Weekly Statistics | |||||
| Week [+] | Tmin °C | Tmax °C | Mean °C | σ | n |
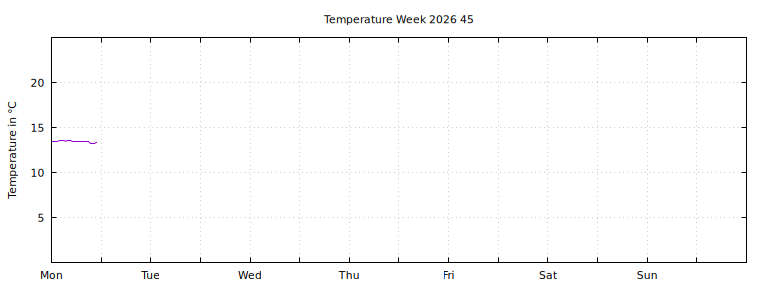
| Week 45 (November 2nd) | 12.7 | 23.8 | 14.0 | 228% | 79 |
| Week 44 (October 27th) | 13.3 | 48.8 | 20.0 | 614% | 283 |
| Week 43 (October 19th) | 17.6 | 67.7 | 34.8 | 1398% | 143 |
| Updated every 30:th minute. |
|
|
| Monthly Statistics | |||||
| Month [-] | Tmin °C | Tmax °C | Mean °C | σ | n |
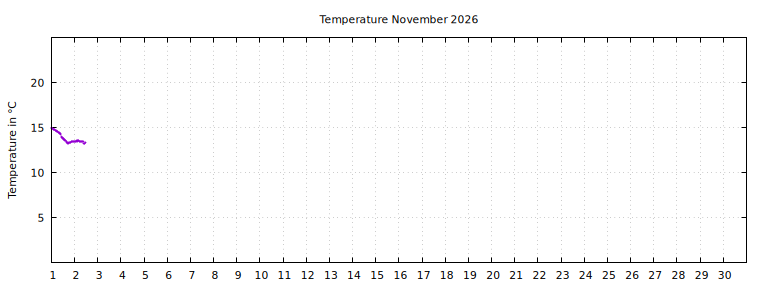
| November 2026 | 12.7 | 23.8 | 14.0 | 184% | 127 |
| October 2026 | 15.0 | 73.6 | 43.4 | 1751% | 1242 |
| September 2026 | 27.9 | 71.6 | 49.6 | 1052% | 1417 |
| August 2026 | 30.2 | 77.7 | 57.5 | 1014% | 1486 |
| July 2026 | 39.4 | 81.8 | 59.8 | 868% | 1485 |
| June 2026 | 28.5 | 79.0 | 51.9 | 1348% | 1439 |
| May 2026 | 16.4 | 75.1 | 43.8 | 1449% | 1003 |
| April 2026 | 10.9 | 78.3 | 34.5 | 1554% | 1391 |
| March 2026 | 13.7 | 74.0 | 34.5 | 1507% | 1189 |
| February 2026 | 10.1 | 71.9 | 24.1 | 1127% | 1342 |
| January 2026 | 10.4 | 71.0 | 32.6 | 1588% | 1487 |
| December 2025 | 10.8 | 81.4 | 36.9 | 2264% | 1488 |
| November 2025 | 13.3 | 75.9 | 35.5 | 1992% | 1435 |
 |
| Yearly Statistics | |||||
| Year [+] | Tmin °C | Tmax °C | Mean °C | σ | n |
| 2026 | 10.1 | 81.8 | 43.3 | 1771% | 13608 |
| 2025 | 9.6 | 81.4 | 38.7 | 1937% | 17141 |
| 2024 | 9.3 | 80.8 | 40.3 | 2115% | 16197 |
Currently 333994 temperuture meausurements in the database.
|
| (c) Daniel Vindevåg 2004-2021 |
))
))
))
))
))
))
))
))
))
))
))
))
))
))
))
))