))
))
))
))
))
))
))
))
| Daily Statistics | |||||
| Day [+] | Tmin °C | Tmax °C | Mean °C | σ | n |
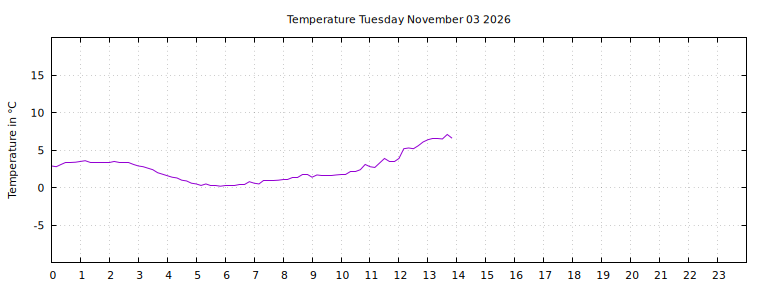
| Tuesday November 3rd | 0.2 | 7.1 | 2.5 | 178% | 84 |
| Monday November 2nd | 3.0 | 7.6 | 6.2 | 102% | 144 |
| Sunday November 1st | 2.7 | 7.0 | 5.5 | 129% | 144 |
| Saturday October 31st | 0.4 | 7.1 | 4.2 | 222% | 144 |
| Friday October 30th | 3.6 | 12.6 | 8.0 | 210% | 144 |
| Weekly Statistics | |||||
| Week [+] | Tmin °C | Tmax °C | Mean °C | σ | n |
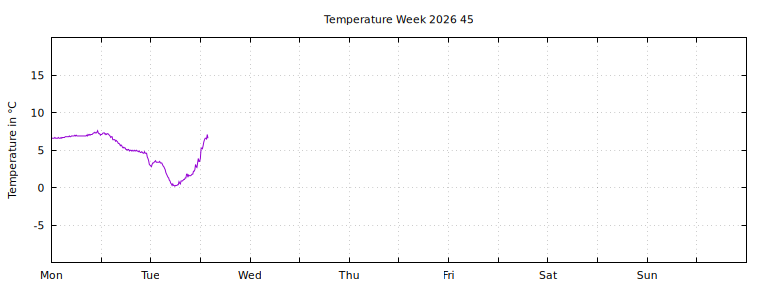
| Week 45 (November 2nd) | 0.2 | 7.6 | 4.9 | 224% | 228 |
| Week 44 (October 27th) | 0.4 | 12.6 | 7.1 | 229% | 849 |
| Week 43 (October 19th) | -1.4 | 10.7 | 5.4 | 359% | 429 |
| Updated every tenth minute. |
|
|
| Monthly Statistics | |||||
| Month [+] | Tmin °C | Tmax °C | Mean °C | σ | n |
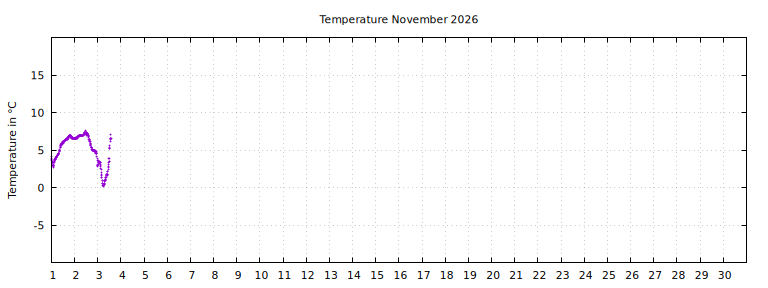
| November 2026 | 0.2 | 7.6 | 5.1 | 195% | 372 |
| October 2026 | -1.4 | 19.8 | 8.1 | 343% | 3726 |
| September 2026 | 3.9 | 19.6 | 12.0 | 251% | 4250 |
 |
| Yearly Statistics | |||||
| Year [-] | Tmin °C | Tmax °C | Mean °C | σ | n |
| 2026 | -19.1 | 31.6 | 7.7 | 836% | 42237 |
| 2025 | -13.6 | 27.6 | 7.2 | 694% | 52037 |
| 2024 | -18.2 | 27.9 | 7.1 | 749% | 51732 |
| 2023 | -14.8 | 26.9 | 6.6 | 757% | 51919 |
| 2022 | -19.1 | 32.4 | 7.0 | 745% | 52119 |
| 2021 | -16.0 | 29.8 | 9.5 | 751% | 33927 |
| 2019 | -9.8 | 29.6 | 4.5 | 688% | 16979 |
| 2018 | -14.6 | 32.9 | 10.0 | 929% | 36472 |
| 2017 | -13.5 | 26.4 | 6.4 | 686% | 43402 |
| 2016 | -17.0 | 28.4 | 7.6 | 777% | 52469 |
Currently 573658 temperuture meausurements in the database.
|
| (c) Daniel Vindevåg 2004-2021 |
))
))
))
))
))
))
))
))
))
))
))
))
))